Friday, May 30, 2008

Google set to grow.

Technical picture shows Google (GOOG) shares returned back above 200 days moving average. This confirms growing trend giving nice signal to long term investors. Open long position with stop loss on level of 200 MA.

Main fuel for Google share were Yahoo (YHOO) - Microsoft (MSFT) - Google (GOOG) deal news together with latest ComScore (SCOR) statistics. Numbers indicate 20% growth in paid clicks. Total clicks growth is 28%. Better than expected data includes only US clicks.
It's still in our mind last ComScore report before Google's Q1. Nevertheless ComScore released slower growth for US clicks, Google posted very good Q1 results which lifted stock. Mainly due to growth outside of US.
Coming back, good US paid clicks rate altogether with possible outstanding global growth. It could be good time to think about Google.

Wednesday, May 28, 2008

ETF market boom. But still behind mutual funds.

European ETF market is still well behind US. By the end of 2007 assets in European ETF bln vs US $581 bln. Nevertheless European assets grew by 43% last year. In terms of issues 423 vs 601. Even thought ETF is the fastest growing retail investment product ETF market makes up only 5% of mutual funds assets in US. In Europe the number is even smaller, around 2%.

Equity based ETF are the most popular. In Europe it's about 80% of the market and in US 90%. Bonds are glamour ETF in Europe.

Worldwide leading issuer is Barclays Global Investors (BSC), iShares. In US followed by State Street Global Advisors, Vanguard, Power Shares, ProShares and others. In Europe first position again for Barclays, then Lyxor and Deutsche Bank (DB) with rapidly growing db x-trackers.

Ten top ETF

ETF Ticker Assets ($ mil)
SPDR Index 500 (SPY) 75,121
iShares MSCI-EAFE (EFA) 47,363
iShares MSCI-Emerging Mkts (EEM) 26,285
iShares S&P 500 (IVV) 18,994
PowerShares QQQ (QQQQ) 17,727
SPDR Equity Gold (GLD) 16,247
iShares Russell 1000 Gr (IWF) 13,447
iShares Russell 2000 (IWM) 10,485
Vanguard MSCI Total Market (VTI) 10,422
iShares Lehman 1-3 Yr Treas (SHY) 9,279

2 Emerging markets, 2 different stories.

With recent interest rate decisions I had closer look into 2 emerging markets in Central Europe. Hungary and Poland. Hungarian central bank again by 25bp (to 8,5%) to tighten monetary policy. Currently highest interest rates since January 2005. Bank acted mainly because of upward inflation. Its outlook has been raised from 3,6% to 4,2%.

Economic picture doesn't look very well. Retail sales down by -4% or construction down by -11%. Industrial output remains positive but with sharp decline to 4%. Numbers are year on year basis. GDP growth stays already one year below 1%. And with current high interest rates it's hard to see soon any revival.

Polish central bank left rates unchanged on 5,75%. The decision mainly taken by better than expected inflation reading (4%). Unemployment shows very positive trend and latest number is 7,7%. Retail sales up by +17,6. Industrial output up by +15%. Nevertheless GDP growth is expected to slow down from 7% to 5,5%, Poland still shows signs of healthy economy.

Finance Yahoo again faster than Finance Google.

I've already 2 times compared 2 major finance portals. Finance Yahoo vs Finance Google. You can see here differences between stock screeners provided by Yahoo and Google. And also my latest analysis for functionality of both portals.

Recently Yahoo released free realtime quotes which have moved portal even more ahead. It is shown on summary page for each ticker. ECN realtime data are provided by BATS Trading.

Monday, May 26, 2008

Business Week. Sell in May?

Tuesday:
Economic Consumer Confidence (61), New Home Sales (520K)
Earnings Vodafone (VOD), Donaldson (DCI), Shanda (SNDA)

Wednesday:
Economic Weekly Crude, Durable Orders (-.7%)
Earnings American Eagle (AEO), CBRL (CBRL), Chico’s (CHS), Daktronics (DAKT), Polo (RL), Dollar Tree (DLTR), Dress Barn (DBRN), Coldwater Creek (CWTR), Men’s Wearhouse (MW), TiVo (TIVO)

Thursday:
Economic Weekly Claims (370K), GDP & Chain Deflator (.9%, 2.6%)
Earnings Costco (COST), Big Lots (BIG), Heinz (HNZ), Joy Global (JOYG), Sears (SHLD), China Finance (JRJC), Dell (DELL), Marvell (MRVL), J Crew (JCG), OmniVision (OVTI)

Friday:
Economic Inc & Spend (.2%, .2%), PCE Core (.1%), Chicago PMI (49), Michigan (60)

Earnings Tiffany (TIF), Lions Gate (LGF)

Sunday, May 25, 2008

Following insider trading - SEC Form 4.

Recently I was browsing internet to find reliable free and not delayed source for insider trading activities. There are couple of sites providing real time information for monthly paid subscription. You can see this also at official SEC site after insiders post Sec Form 4. But this is not really friendly format.

I found FinViz which gives you everything for free. You can see buy sell transaction with share price, value and position of insiders. What I am still missing is searching per ticker.

Site provides also technical and fundamental screener. Moreover it has very nice maps grouped by industry. You can see performance of major companies or ETF in industry. Or basic fundamental data like P/E ratio, P/B, PEG, EPS or dividend yield.


I'd underline this is not paid review as StockWeb never publishes paid reviews. This is recommendation for the site which I found as a very useful source of information. As usual I put link to sidebar section "Stock screeners".

Tuesday, May 20, 2008

Steve Ballmer under eggs attack.

This is first time I post video on my blog. Clip shows CEO of Microsoft (MSFT) being egged during his speech in Hungary. Hungarian protester accused Microsoft from stealing taxpayer money.


Steve Ballmer has this Thursday schedule to visit Czech Republic on Thursday. Let's see what we can expect in Prague. Except of speech for University students he is going to meet Ivo Lukacovic, Head of Seznam . cz (biggest Czech online portal). As I already posted couple of weeks ago there are ongoing rumours about acquisition (M&A - Internet companies).

Monday, May 19, 2008

Business Week. VIX close to October 07 lows.

Monday
Economic: Leading Inds (0.0%)
Earnings: Campbell’s (CPB), Excel Maritime (EXM), Lowe’s (LOW), Perfect World (PWRD), DryShips (DRYS)

Tuesday
Economic: PPI & Core (0.0%, 0.2%)
Earnings: AutoZone (AZO), China Energy (CSUN), Home Depot (HD), Target (TGT), Analog Devices (ADI), Hewlett (HPQ), Intuit (INTU)

Wednesday
Economic: Weekly Crude, FOMC Minutes
Earnings: BJ’s (BJ), Ross (ROST), Solarfun (SOLF), Tsakos (TNP), Bristow (BRS), Gymboree (GYMB), Netease (NTES), Network Apps (NTAP), PETsMART (PETM), Salesforce (CRM)

Thursday
Economic: Weekly Claims (370K)
Earnings: AnnTaylor (ANN), Barnes & Noble (BKS), Children’s Place (PLCE), Dick’s (DKS), Gamestop (GME), Patterson (PDCO), Toro (TTC), Trina Solar (TSL), Aeropostale (ARO), Gap (GPS), Verigy (VRGY), Zumiez (ZUMZ)

Friday
Economic: Existing Home Sales (4.85M)
Earnings: NA

Sunday, May 18, 2008

Earnings for Q1.

Only 6% remains of S&P500 companies to post Q1 earnings. Actually earnings fell by -17,5% against estimated growth +5,7% (data provided by Thomson on 1st Jan 08). Huge "contribution" had financials sector. Compared to Q1 2007 financials posted $142 bln less and finished quarter in loss of $28 bln.

Q1 started badly by General Electric (GE) which didn't provide bright outlook for other earnings. Nevertheless it wasn't so bad quarter. If two sectors (the best - energy; the worst - financials) are taken out earnings actually grew by 2,9%. That's not so far from optimistic January estimates.

Estimation for Q2 2008 are currently set negative -5,4%.

Thursday, May 15, 2008

No recession for Europe.

Today released numbers show good shape for European economies. Germany more than doubled estimations and grew 1.5% in first three months of 2008 (quarter on quarter). Non-seasonally (quarterly basis) GDP grew 1,8%.
Another surprise is coming from France. Quarter on quarter growth by 0,6%. Great Britain up by 0,4%.Smaller European economies, Greece +1,1% and Austria +0,8%. But others shrank slightly. Portugal and Spain registered in the negative, -0,2% respectively -0,3%.

And how about Central European emerging markets. Czech Republic quarter on quarter +0,9% but non-seasonally still nice growth by 5,4%. Slovakia non-seasonally slow down from 14,3% to 8,7%.

Wednesday, May 14, 2008

Banking losses in Europe.

Credit market turmoils spread all over. I list major 4 major banking cases occurred in Europe due to subprime meltdown.

The largest Swiss bank UBS (UBS) writedowns almost 33 bln CHF in last 2 quarters. Shareholders approved capital increase by 15 bln CHF. Already second capital hike after 13 bln CHF from two foreign sovereign wealth funds. Shares price YTD down by 33%.

Credit Suisse (CS) faced first quarter losses in last 5 years (1Q 2008 with loss 2,15 bln CHF). For the same quarter in 2007 company made profit 2,7 bln CHF. From the beginning of year shares price fell down by 11% and market capitalization is now 62,6 bln CHF.

Royal Bank of Scotland (RBS) lost 5,9 bln GBP. In addition to subprime losses bank admits another bad investment decisions. Mainly acquisition of ABN Ambro Holding (together with Banco Santander and Fortis). 71 bln EUR for ABN Ambro was too ambitious. Royal Bank of Scotland announced last month a rights issue of 12 bln GBP. Shares price YTD down by 29%.

So far Deutsche Bank (DB) looked very resistant against turmoils. But Q1 showed different picture, losses 2,7 bln EUR. According to CEO Josef Ackermann April already shows signs of stabilization. For Deutsche Bank it was also first quartal loss since 2003. Shares price YTD down by 9%.

Monday, May 12, 2008

International ETF in focus.

Recently I posted how international ETF stand in relation P/E to GDP (link to post). The most undervalued seemed to be emerging markets of BRIC (Brazil, Russia, India, China).

World markets had turned to negative on October and have started bear market which lasts already 6 months. But major fall happened at the beginning of year 2008. I run my screen for ETF to see the leaders and laggards on YTD basis. Her you have result.


ETF Ticker ROC %
Brazil (EWZ) 16.3
Mexico (EWW) 9.1
Canada (EWC) 6
Russia (RSX) 3.9
Australia (EWA) 2.2
Spain (EWP) 1.1
Japan (EWJ) -0.6
U.K. (EWU) -3
France (EWQ) -3.2
US (IVV) -3.5
Italy (EWI) -5.6
Germany (EWG) -5.9
S. Korea (EWY) -7.8
China (FXI) -10.4
Hong Kong (EWH) -12
India (INP) -28.1

Business Week. CPI data.

Monday
Economic: Treasury Budget ($157.5B)
Earnings: CryptoLogic (CRYP), Holly (HOC), Hecla (HL), JA Solar (JASO), MBIA (MBI), Sprint (S), XM Satellite (XMSR), Clearwire (CLWR), Fluor (FLR), LDK Solar (LDK), Time Warner Tcom (TWTC), McDermott (MDR), Nuance (NUAN)

Tuesday
Economic: Import / Export, Retail Sales (0.0%, .2%), Biz Inventories (.5%)
Earnings: Camico (CCJ), Canadian Solar (CSIQ), DISH (DISH), Fossil (FOSL), GigaMedia (GIGM), HOKU (HOKU), Liz Claiborne (LIZ), TJX (TJX), VeraSun (VSE), Wal-Mart (WMT), Applied Materials (AMAT), Electronic Arts (ERTS), Home Inns (HMIN), MercadoLibre (MELI), Pan Am Silver (PAAS), Whole Foods (WFMI)

Wednesday
Economic: Weekly Crude, CPI & Core (.3%, .2%)
Earnings: Deere (DE), Diana Ship (DSX), Freddie (FRE), Jack Box (JBX), Macy’s (M), Agilent (A), Brocade (BRCD), Ctrip.com (CTRP), Sina (SINA), Teekay (TK)

Thursday
Economic: Weekly Claims (365K), Empire (1.0), CU & IP (80.2%, -.2%), Philly Fed (-20)
Earnings: Blackstone (BX), Blockbuster (BBI), Daimler (DAI), JC Penney (JCP), Urban Outfitters (URBN), Yingli Green (YGE), Autodesk (ADSK), BMC (BMC), Focus Media (FMCN), Hewlett Packard (HPQ), Nordstrom (JWN), Salesforce (CRM)

Friday
Economic: Housing Starts & Build P’s (940K, 912K), Michigan (63)
Earnings: Abercrombie (ANF)

Friday, May 9, 2008

Structured investments - ETF vs. ETN.

ETF and ETN are becoming more and more popular products for many investors. Sometimes it is used for investing before "real" stock trading. Both offer many advantages compare to mutual funds. Exchange traded funds or notes you can traded directly on exchange. It means you can buy or sell anytime for market price.

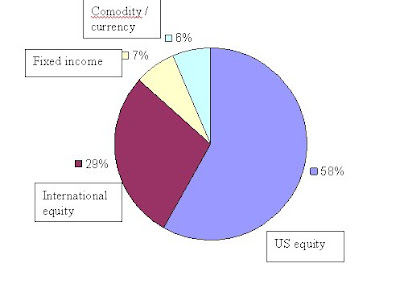
ETF are still dominant with assets value $602 bln. ETN now accounts $6 bln but increasing rapidly during last year. We could see almost 200% growth in assets value from $2,1 bln to current $6 bln. ETF market grew by 26%.

ETN market is not only Barclays' as it was still one year ago. Swedish Export Credit, Deutsche Bank, Bear Stearns, Morgan Stanley and others now take around 20% of its value.

Category allocation for ETF and ETN

Related tickers: (BCS), (EEH), (DB), (BSC), (MS), (UBS), (LEH), (CS),
Data source: National Stock Exchange

Top 10 ETF.

ETF market is booming. Let's have a look which ETF are currently the biggest in terms of assets value. SPY is still leading and has also biggest nominal increase year on year basis. Among top 10, the highest percentage assets increase has been seen for Emerging market EEM (63%). Followed by Gold GLD 51%.
That's where ETF money had flowed in last 12 months.


ETF Ticker Assets ($ mil)
SPDR Index 500 (SPY) 75,121
iShares MSCI-EAFE (EFA) 47,363
iShares MSCI-Emerging Mkts (EEM) 26,285
iShares S&P 500 (IVV) 18,994
PowerShares QQQ (QQQQ) 17,727
SPDR Equity Gold (GLD) 16,247
iShares Russell 1000 Gr (IWF) 13,447
iShares Russell 2000 (IWM) 10,485
Vanguard MSCI Total Market (VTI) 10,422
iShares Lehman 1-3 Yr Treas (SHY) 9,279

Difference between ETF and ETN.

Exchange traded funds (ETF) and Exchange traded notes (ETN) are derivatives underlying investment assets (stocks, indexes, commodities etc.). Issuer are big investment banks.

ETF represents in fact ownership for underlying assets. Therefore especially big institutional holders could and also do asking to redeem their ETF position for underlying stocks. This makes ETF price staying closely along underlying stocks. For example this is not the case for Closed end funds - CEF.

Contrary ETN is kind of structured product issued as a debt note. And that's why credit risk is here. Of course nobody really expect Barclays' goes bankrupt. ETN are lack of tracking risk. It means that price exactly reflects underlying index. ETF can differ from NAV.

Wednesday, May 7, 2008

Yahoo Finance vs Google Finance.

I've already compared those 2 major finance portals but in reference to stocks screening. You can see my post here. Do you prefer Google or Yahoo? Let me point out some pros and cons.

Initial page
Yahoo has very well organized structure. It is more than just stock markets. You have all aspects of finance world structured in top scroll down menu. Market summary even for major European and Asian indices. Top stories are excellently highlighted. On the other side. It has advertisements. And no possibility to be personalized.

Google offers nice sectors summary where the money flows. You have possibility to see your portfolio already on initial page. You don't see any ads. Now disadvantages. The biggest is top stories. It really misses the way how Yahoo can pick the most important stories and particularly highlight them. Next con, Google is here just for US indices.


Quotes
Here Google proves to be nr.1 search engine. You don't need to remember ticker, just type company name and Google gets it. Yahoo is different. You must type ticker or use look up function.

Statistics and indicators
Yahoo wins this part. Indicators, news, statistics are better organized. And Google doesn't even offer Analyst estimates, SEC fillings, options etc.
They just refer via link to different financial sites.

Charts
In terms of charting both are equals. I don't find many differences.

Altogether Yahoo Finance is better. Major benefits are better news structure, international exposure (localized Finance sites in different countries), better indicators and statistics for quotes. Those are 3 main reasons why I am using Yahoo.

Monday, May 5, 2008

GDP growth vs. P/E for international ETF.

One indicator, PEG, of fundamental analysis measures P/E relative to growth (EPS growth). It is especially helpful to compare stocks, indexes. Low P/E not necessary means under valuated price. It's always needed to compare with potential growth. PEG indicator uses EPS growth as a denominator.

I made following analysis for world stock markets. Assets are regional ETF underlying international stocks. It's not problem to find P/E ratio for ETF in question but it's always difficult to find EPS respectively EPS growth data. Therefore I used expected GDP growth (2008) for world economies (based on IMF prediction). Which means as a PEG denominator is GDP growth instead of EPS growth.


International ETF - fundamental data.

As you can see the best valuation (the lowest PEG) is for China followed by India, Brazil and Russia. All emerging countries of BRIC.

Scatter chart below shows where international ETF stand in relation P/E ratio vs. GDP growth. The farest ETF from diagonal on the right side means the most under valuated. On the left we talk about over valuated.


Related tickers: (EWI), (IVV), (EWC), (EWJ), (EWG), (EWQ), (EWU), (EWP), (EWW), (EWY), (EWA), (EWZ), (EWH), (RSX), (INP), (FXI)

GDP growth prediction for global economies.

This is the latest prediction for GDP growth from International Monetary Fund IMF. You can see world economic outlook for 2008 and 2009. Numbers are released on April. Middle East and Africa seems to be averse to global slowdown. At least in view of IMF.

Business Week. 30% earnings call for Q1 still open.

Monday
Economic ISM Services (49.5)
Earnings Goldcorp (GG), Marvel (MVL), Tidewater (TDW), Airgas (ARG), Anadarko (APC), McKesson (MCK), Ternium (TX), Weight Watchers (WTW)

Tuesday
Economic NA
Earnings Barrick (ABX), Fannie (FNM), Molson (TAP), PG&E (PCG), Blue Nile (NILE), J2 Global (JCOM), Ormat (ORA), Synchronoss (SNCR), Tenaris (TS), ValueClick (VCLK), Disney (DIS), WMS (WMS)

Wednesday
Economic Weekly Crude, Pending Home (-0.6%), Productivity (1.2%), Consumer Credit ($6.3B)
Earnings Cognizant (CTSH), DIRECTV (DTV), FTI Consult (FCN), Lamar (LAMR), Comtech (COGO), Crocs (CROX), Mindray (MR)

Thursday
Economic Weekly Claims (370K), Wholesale Inv’s (0.4%)
Earnings Aecom (ACM), Alliant (ATK), AmBev (ABV), Celgene (CELG), Fortress (FIG), NASDAQ (NDAQ), OM Group (OMG), Tesoro (TSO), Urban O’Fitters (URBN), Agnico (AEM), Darling Intl (DAR), Hansen (HANS), MercadoLibre (MELI), NVIDIA (NVDA), Priceline (PCLN), Titanium Metals (TIE), VeriSign (VRSN), Zoltek (ZOLT)

Friday
|Economic Trade Balance (-$61.3B)
Earnings Aircastle (AYR), Clear Channel (CCU), Omrix (OMRI), Southern Union (SUG), Warner Chilcott (WCRX)

Sunday, May 4, 2008

Microsoft abandons bid for Yahoo.

Finally Microsoft (MSFT) stepped back from acquisition discussion with Yahoo (YHOO). The price $37 per share was just too much.

Who is winner and who is looser?
Microsoft will not have additional complications to fulfill dividends plan to its shareholders. They will be focused on their core software business. But Internet business, it is still lost game for Microsoft.

Yahoo continues talks about partnership with Google (GOOG). And maybe there is potential deal with AOL (TWX) or News Corporation (NWS). Definitely Yahoo shares will be under selling pressure on Monday. Last quarter nothing exciting and company is loosing market share against its rival Google.

Google is winning the game. Still there is not any other power to cut their market share.

Friday, May 2, 2008

Search Engines.

Coming back to the latest statistics released by ComScore in mid of April. It shows the biggest growth in searching for Google among heavily used engines. Month on month the change is +12%. But total winner is Craigslist with 16%. This is very good result for Craigslist. It generates now almost one third of search queries on AOL.

Company Mar 08 (MM) MOM growth
Google Sites 8,267 12%
Yahoo! Sites 2,391 6%
Microsoft Sites 1,054 7%
AOL LLC 891 3%
Ask Network 506 12%
Ebay 474 -1%
Fox Interactive 377 12%
craigslist 277 16%


Another interesting comparison is for social networking sites like Facebook, MySpace, YouTube. YouTube already counts one fifth of total Google's sites. MySpace is still winning the game vs. Facebook.

Company Mar 08 (MM) MOM growth
YouTube 1,736 18%
MySpace 368 12%
Facebook 107 4%

Online sellers. Amazon is growing faster than eBay. Actually eBay is the only one engine which dropped.

Company Mar 08 (MM) MOM growth
eBay 474 -1%
Amazon 149 7%

Related tickers: (GOOG), (MSFT), (YHOO), (EBAY), (AMZN), (TWX), (SCOR),